Correction of Erythrocyte Surface Charge by Magnetite Nanoparticles: Bridging Biophysics and Clinical Application
Abstract
The reduction of erythrocyte Electrophoretic Mobility (EPM) is an important diagnostic marker of pathological conditions. In in vitro studies, severe toxemia decreased EPM by 64.0% and membrane ζ-potential by 39.5% compared to the control group. Treatment of blood with biocompatible magnetite nanoparticles (brand MCS-B) restored both parameters toward normal levels, with the most pronounced effect observed at a blood-to-nanoparticle ratio of 2:1 (ΔEPM = +198.4%, Δζ = +60.7%). A strong correlation was observed between EPM and ζ-potential (r = 0.91–0.95) with a large effect size (Cohen’s d > 1.2). Exposure to MCS-B resulted in a statistically significant increase in erythrocyte mobility (p < 0.001), nearly restoring EPM to or slightly above control levels. Optimal efficacy was achieved at a blood-to-nanoparticle ratio of 2:1, while ratios of 3:1 and 1:1 showed partial restoration. Additionally, application of a constant magnetic field with an intensity of 200 kA/m to 250 kA/m for 2–3 minutes effectively removed residual nanoparticles from the blood samples (p < 0.001). These results demonstrate the biocompatibility of MCS-B and confirm its ability to restore erythrocyte membrane charge under conditions of severe toxemia. They highlight the clinical potential of this nanomedicine approach as a foundation for novel therapeutic strategies in transfusiology, intensive care, and regenerative medicine. The study addresses a relevant interdisciplinary challenge, integrating hematology, biophysics, and nanotechnology, which is significant for both fundamental science and clinical application.
Keywords:
Magnetite Nanoparticles (MCS-B); Erythrocyte electrophoretic mobility; ζ-potential; Nanomedicine; Toxemia; Regenerative medicine
Introduction
The Electrophoretic Mobility of erythrocytes (EPM) is a significant biophysical parameter. It reflects the state of cellular membranes and their surface charge. This indicator provides important information about the functional condition of erythrocytes across a wide range of physiological and pathological states. As a parameter associated with the surface charge of cell membranes, EPM is highly sensitive to changes in membrane composition and structural integrity. Modifications in EPM have been observed in response to oxidative stress, systemic inflammation, oncological diseases, and aging-related processes. Due to its sensitivity and non-invasiveness, the analysis of erythrocyte electrophoretic mobility represents a promising supplementary approach. It can be applied in clinical diagnostics and biomedical research. For example, EPM assessment may help detect early membrane disturbances in systemic pathologies. It can also be used to monitor therapeutic efficacy and predict disease progression. These capabilities are directly linked to the biophysical and biochemical properties of the erythrocyte membrane. They are also influenced by internal and external environmental factors that determine electrophoretic mobility.
1. Properties of the erythrocyte membrane.
- Surface charge and sialic acids. Sialic acids contribute to the negative charge of the membrane. Their loss leads to a decrease in erythrocyte Electrophoretic Mobility (EPM) [1,2].
- Phospholipid and protein composition. Alterations in the lipid-protein composition, for example during inflammation or diabetes, modify the electrophysiological characteristics of the membrane [3].
- Membrane fluidity and viscosity. These parameters depend on the cholesterol-to-phospholipid ratio. Increased membrane rigidity reduces EPM [4].
2. Biochemical and metabolic factors.
- Oxidative stress. Lipid peroxidation and membrane protein damage reduce erythrocyte mobility [5-7].
- pH of the medium. In acidosis, membrane proteins become protonated. This reduces their negative charge and decreases EPM [8,9].
3. Physiological and pathological conditions.
- Erythrocyte aging. Aging erythrocytes show decreased sialic acid content and reduced electrophoretic mobility [10].
- Inflammation. Acute-phase proteins, such as fibrinogen and CRP, adsorb onto the membrane. This alters its surface charge [11].
- Anemia, oncological, and autoimmune diseases. These conditions may reduce EPM due to structural and biochemical alterations of the membrane [12-14].
4. External factors
- Pharmacological agents. Certain drugs can affect membrane stability and charge [15,16].
- Colloid solutions and procedures. Treatments such as plasmapheresis may temporarily change plasma viscosity and conductivity [16].
5. Aging and age-related changes.
With advancing age, erythrocyte membrane composition and structure are progressively disrupted, including a reduction in sialic acid content. This leads to a decreased negative surface charge and lower Electrophoretic Mobility (EPM) [17].
Reduced EPM has important functional consequences: it reflects impaired membrane function, slows microcirculation, and diminishes tissue oxygen delivery. Alterations in erythrocyte shape or membrane proteins further compromise capillary flow and oxygenation. As a result, blood viscosity increases and the risk of thrombosis rises, particularly in organs with high metabolic demand, such as the brain and heart. Thus, decreased EPM is not only a laboratory marker of aging but also a pathophysiologically significant factor contributing dysfunction and tissue hypoxia.
Nanotechnological modulation of the biophysical properties of erythrocytes: new horizonsRecent advances in nanotechnology offer new opportunities for modulating the biophysical properties of blood cells, particularly erythrocytes. Of particular interest is the potential for targeted modulation of EPM by nanoparticles, as this parameter reflects the surface charge, structural integrity, and functional state of cell membranes.
An article published in micro and nano systems letters investigates the effects of pure (ligand-free) magnetite nanoparticles embedded in a sodium chloride matrix on hematological parameters, blood gases, electrolytes, and serum iron. The results demonstrate that such nanoparticles can influence these parameters, which is essential for assessing their biocompatibility and potential impact on erythrocytes [18].
A study published in the Journal of Nanoscience and Nanotechnology explores the interaction between erythrocytes and magnetite nanoparticles. The findings indicate that erythrocytes are capable of internalizing magnetite nanoparticles, which may alter their physicochemical properties and functionality [19].
An article in toxicology research examines the hematotoxicity of Polyethylene Glycol (PEG)-coated magnetite nanoparticles under both in vitro and in vivo conditions. The results reveal that such nanoparticles can exert toxic effects on erythrocytes, which is a critical consideration in the development of nanomaterials for medical applications [20].
Thus, biocompatible nanoparticles - particularly those based on magnetite - are capable of interacting with erythrocyte membranes, modifying their electrostatic and rheological properties. Controlled modulation of erythrocyte electrophoretic mobility by nanoparticles offers the potential to correct hemorheological disorders and optimize microcirculatory function, thereby opening new avenues for nanomedical therapy and treatment monitoring.
The results of the present study highlight the importance of a thorough understanding of the interactions between magnetite nanoparticles and erythrocytes, especially in the context of their application in advanced medical technologies. In this regard, investigating the impact of magnetite nanoparticles on EPM represents a timely and promising direction in the fields of biophysics and nanomedicine.
To date, numerous types of magnetic nanoparticles have been synthesized and are actively employed in clinical practice - for applications ranging from magnetic resonance imaging and targeted drug delivery to magnetic hyperthermia. However, despite their therapeutic potential, these nanoparticles may exert not only modulatory but, in certain cases, cytotoxic effects on blood cells.
Biocompatible magnetite-based nanoparticles were developed in 1995 in Ukraine by Professor Andrey Nikolaevych Belousov, Doctor of Medical Sciences. These formulations - marketed under the proprietary names Micromage-B, MCS-B, and ICNB - represent the first nanotechnology-based medicinal products in the world to be officially registered and approved for clinical use by a national health authority (Ministry of Health of Ukraine, registration granted in 1998).
These nanoscale agents are not cytostatic in nature. Instead, their mechanism of action involves modulation and activation of endogenous physiological processes, including but not limited to:
- immune system stimulation,
- enhancement of antioxidant defense mechanisms,
- activation of phagocytosis,
- facilitation of endogenous detoxification pathways.
The aforementioned nanopreparations have demonstrated clinical safety and efficacy as adjunctive therapies in the management of:
- neurodegenerative diseases,
- autoimmune disorders,
- toxic and post-toxic syndromes,
- malignant tumors.
The invention provides a novel class of magnetically responsive, biologically active nanomaterials with a unique profile of non-cytotoxic systemic modulation, opening new pathways for nanomedical interventions in complex and multifactorial pathologies.
Their mechanism of action is based on controlled sorption of toxins and stabilization of cellular membranes at the nanostructural level [21-23].
Due to their non-toxic nature, these agents are suitable for long-term use in the management of chronic diseases. Their therapeutic activity is not dependent on the genetic profile of the target cell, allowing for broad applicability across diverse pathological conditions [24-27].
Each magnetite nanoparticle represents a subdomain elementary magnet with a size ranging from 6 nm to 12 nm. When exposed to a constant magnetic field of 300 kA/m to 400 kA/m, not only is the mechanism of selective sorption via magnetophoresis [24] activated, but there is also modulation of cellular metabolic activity and resolution of the “sludge syndrome” phenomenon [26,28]. Collectively, these effects contribute to the activation of sanogenetic mechanisms, induction of hemocorrection, and non-specific stimulation of the body’s natural detoxification processes [21].
These findings emphasize the scientific relevance of further investigation into the effects of magnetite nanoparticles on the bioelectrical properties of blood cell membranes in patients with clinical manifestations of toxemia. In this context, particular attention is given to the assessment of erythrocyte electrophoretic mobility as a sensitive biophysical marker of membrane alterations.
The aim of the present study is to develop an innovative nanomedical platform based on biocompatible magnetite nanoparticles capable of restoring erythrocyte Electrophoretic Mobility (EPM) under conditions of toxemia and hypoxia.
Materials and Methods
Study materialErythrocytes obtained from the blood of practically healthy individuals and patients presenting with clinical signs of toxemia. The condition of erythrocytes was assessed in a total of 30 individuals. The sample size (n=30) was determined a priori based on the expected large effect size (d ≈ 1.2), a significance level of α=0.05, and a power of 80%, providing sufficient statistical sensitivity to detect differences between groups. All participants were conditionally divided into two groups:
- Group I (Donors): 10 practically healthy volunteers (Table 1);
- Group II (Main group): 20 patients with clinical manifestations of toxemia who were admitted to the intensive care unit (Table 2).
Table 1: Distribution of donors by age and sex.
| Number of Donors (volunteers among practically healthy individuals) | Age (years), sex, number of individuals | |||
|---|---|---|---|---|
| 35-45 | 45-55 | |||
| M | F | M | F | |
| 10 | 4 | 1 | 3 | 2 |
Table 2: Distribution of patients in the main group by age, sex, and diagnosis.
| Diagnosis | 35-45 | 35-45 | 45-55 | 45-55 | Total (n/%) |
|---|---|---|---|---|---|
| M | F | M | F | ||
| Acute gangrenous cholecystitis in gallstone disease | 2 | 2 | 2 | 2 | 8/40% |
| Chronic hepatitis | 2 | - | 3 | - | 5/25% |
| Liver cirrhosis (stage I-II) | - | - | 2 | - | 2/10% |
| Acute purulent pancreonecrosis with peritonitis | 4 | - | 1 | - | 5/25% |
| Total | 8 | 2 | 8 | 2 | 20/100% |
Physicochemical parameters of magnetite nanoparticles (Magnetically Controlled Sorbent “MCS-B” Brand).
The magnetically controlled sorbent (MCS-B brand) consists of stabilized magnetite (Fe3O4) nanoparticles ranging in size from 6 nm to 12 nm. The main physicochemical properties of MCS-B are summarized below, as well as in Tables 3-6 and Figures 1-3:
- Total surface area of the magnetite nanoparticles: Sa = 800 m2/g - 1000 m2/g
- Saturation magnetization: Is = 2.15 kA/m
Table 3: The calculated lattice parameters of the phases.
| Phase name | a (Å) | b (Å) | c (Å) | alpha (degree) | beta (degree) | gamma (degree) |
|---|---|---|---|---|---|---|
| magnetite low | 8.387836 | 8.387836 | 8.387836 | 90 | 90 | 90 |
| magnetite low, syn | 5.930687 | 5.930687 | 14.705912 | 90 | 90 | 120 |
| Johannsenite | 9.89168 | 9.059276 | 5.282908 | 90 | 105.54 | 90 |
Table 4: Determination of percent composition of the ICNB by Х-ray spectrometer ARL OPTIM'X (semi- quantitative analysis).
| Compound | Weight% | StdErr | El | Weight%/O2 | StdErr | El | Weight% | StdErr |
|---|---|---|---|---|---|---|---|---|
| Fe3O4 | 97.37 | 0.09 | Fe | 68.4 | 0.07 | Fe | 97.62 | 0.09 |
| CaO | 2.26 | 0.07 | Ca | 1.71 | 0.05 | Ca | 2.3 | 0.07 |
| P2O5 | 0.28 | 0.027 | Px | 0.122 | 0.012 | Px | 0.157 | 0.015 |
| MnO | 0.255 | 0.013 | Mn | 0.198 | 0.01 | Mn | 0.278 | 0.014 |
| SiO2 | 0.098 | 0.027 | Si | 0.046 | 0.013 | Si | 0.059 | 0.016 |
| SO3 | 0.032 | 0.013 | Sx | 0.0126 | 0.0051 | Sx | 0.0164 | 0.0066 |
| Cl | 0.028 | 0.009 | Cl | 0.028 | 0.009 | Cl | 0.038 | 0.012 |
Table 5: X-ray analysis of ICNB in X-ray diffractometer Rigaku Ultima IV (CuKα, Kβ filter - Ni), one-coordinate DTeX semiconductor detector.
| Phase | Formula | Space group | No Card Database ICDD |
|---|---|---|---|
| magnetite low | Fe2.886O4 | 227: Fd-3m, choice-2 | 10861339 (ICDD) |
| magnetite low, syn |
Fe3O4 | 166: R-3m, hexagonal | 10716766 (ICDD) |
| Johannsenite |
Ca Mn +2 Si2O6 |
15: C12/c1, unique-b, cell-1 | 380413 (ICDD) |
Table 6: The phases of magnetite of nanoparticles (RIR - method; error 8% ± 3%).
| Phases (method of corundum numbers) | Content, % |
|---|---|
| magnetite low | 71 |
| magnetite low, syn (hexagonal) | 29 |
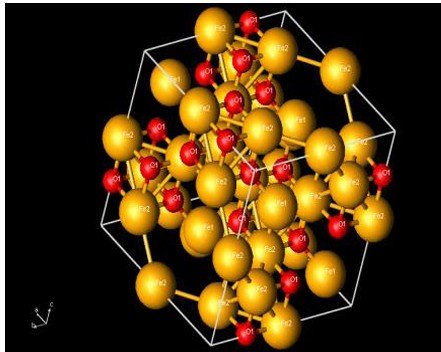
Figure 1: Spatial structure of MCS-B (Fd-3m phase). Analysis and modeling by E.P. Danshina, Research Fellow, Center for Collective Use of Scientific Equipment, Belgorod State University, “Diagnostics of the Structure and Properties of Nanomaterials,” 2006.
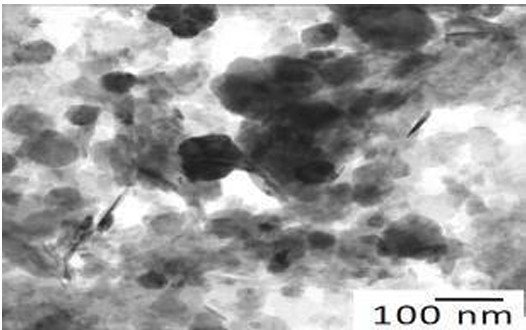
Figure 2: Study of magnetite nanoparticles with use microscope ionelectronic raster-type Quanta 200 3D.
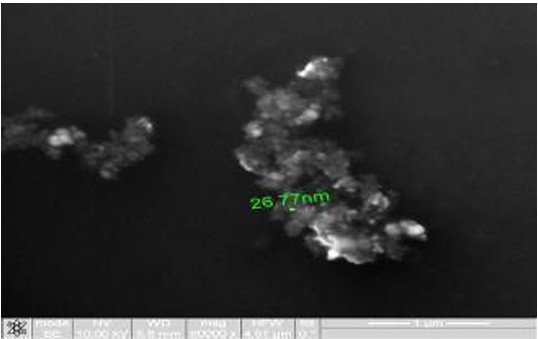
Figure 3: Study of magnetite nanoparticles with use microscope electronic translucent JEM-2100.
- Volume concentration: q=0.00448
- Viscosity: η=1.0112 cSt
- Zeta potential: ζ=-19 mV
The small size of the magnetite nanoparticles provides a relatively large specific sorption surface area (Sa = 800 m2/g to 1200 m2/g). Physicochemical characteristics such as volume concentration (q = 0.00448) and viscosity (η = 1.0112 cSt) allow for rapid and uniform distribution of MCS-B throughout the volume of the blood plasma sample. The saturation magnetization (Is = 2.15 kA/m) not only ensures high polarization capacity of MCS-B but also facilitates its rapid and efficient removal from blood plasma using a low-intensity external constant magnetic field [21].
The stability of the nanoparticles in biological media is ensured by:
- a negative ζ-potential (~ -19 mV), providing colloidal stability
- nanoscale size (6-12 nm), preventing sedimentation
- a protein corona formed in plasma
In whole blood and plasma:
- aggregation is limited;
- magnetic responsiveness is retained;
- adsorption properties are preserved.
These findings confirm the suitability of MCS-B for use in physiological fluids.
The X-Ray Diffraction (XRD) data (Rigaku Ultima IV) presented in Table 5 confirm that the main phase of the material corresponds to magnetite Fe3O4 with a spinel crystal structure (space group Fd-3m, ICDD 10861339). Additionally, a minor hexagonal modification (R-3m) was detected, along with trace amounts of a silicate phase (johannsenite).
According to RIR analysis:
- Magnetite (cubic phase): ~71%
- Magnetite (hexagonal modification): ~29%
The observed lattice parameters (a ≈ 8.38 Å) are consistent with reference values for nanocrystalline magnetite. The absence of pronounced amorphous peaks and the narrow width of the diffraction maxima indicate high crystallinity and structural stability of the particles. The spatial structure of MCS-B (Fd-3m phase) is shown in Figure 1.
The sorption activity of MCS-B for various substances present in liquid media is presented in Table 7.
Method for investigating erythrocyte electrophoretic mobility and determining the optimal effective dose of MCS-B.
Electrophoretic mobility was measured using an electrophoresis apparatus according to the methodology described in [29]. The electrical circuit diagram of the electrophoresis setup is shown in Figure 4.
Table 7: Some data sorption activity of MCS-B* for a various sort of the substances which are taking place in biological liquid.
| Substance | Biological liquid | ||
|---|---|---|---|
| H2O | Plasma of blood | The blood | |
| Phenol | 1 mcg | 0.05 mcg | 0.05 mcg |
| Albumin | Absent | Absent | |
| Creatinin | Absent | Absent | |
| Urine | Absent | Absent | Absent |
| Cholesterol | 10 mcg | 10 mcg | |
| Hormone T3 | Absent | Absent | |
| Cu | 1.75 mcg | 2.5 mcg | 1 mcg |
| Ca | Absent | Absent | Absent |
| K | Absent | Absent | Absent |
| Na | Absent | Absent | Absent |
| Cl | Absent | Absent | Absent |
| Mg | Absent | Absent | Absent |
| Zn | 10 mcg | Absent | 0.75 mcg |
| NaNO3 (nitrates) | 12.5 mcg | 10 mcg | Absent |
| Cr | 2 mcg | 0.49 mcg | 0.5 mcg |
| Pb | 1.17 mcg | 0.3 mcg | 0,19 mcg |
| Cd | 0.48 mcg | 0.68 mcg | 1.55 mcg |
| Ig A | 500 mcmol | 300 mcmol | 250 mcmol |
| Ig M | 200 mcmol | 350 mcmol | 250 mcmol |
| Ig G | Absent | 200 mcmol | 250 mcmol |
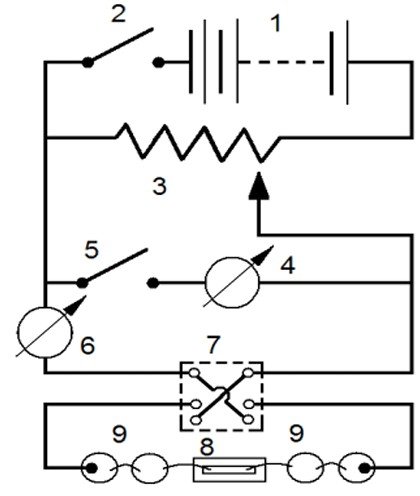
Figure 4: Electrical circuit diagram of the electrophoresis system.
Legend: 1 – battery, 2 – switch, 3 – potentiometer, 4 – voltmeter, 5 – voltmeter activation switch, 6 – milliammeter, 7 – six-pole switch, 8 – chamber, 9 – non-polarizable electrodes.
The power source consisted of a rechargeable battery with a voltage of 80 V to 100 V. A Rustrat-type rheostat with a resistance of 4 kOhm to 5 kOhm was used as a potentiometer and connected in series. A voltmeter was connected in parallel to the potentiometer. The current was supplied to the measurement chamber via a commutator that allowed for easy reversal of the current direction. The current was applied to non-polarizable electrodes. As shown in the figure, copper conductors were immersed in containers filled with a saturated solution of CuSO4. These containers were connected to others containing a 10% KCl solution. The latter were connected to the chamber via agar bridges (siphons). A milliammeter with a measuring range of 50 mA to 100 mA was included in the circuit to monitor current intensity. The chamber was placed on the microscope stage, while the non-polarizable electrodes were positioned on a stand on either side of the microscope.
Procedure and calculationsThe object of the study was erythrocytes, which were placed into a chamber equipped with non-polarizable electrodes. Cell movement was monitored using a microscope, the eyepiece of which was fitted with a calibrated reticle. The scale calibration of the grid was: 30 divisions=10 µm.
For each blood sample, two in vitro experiments were performed. The first used an untreated blood sample from a patient; the second used the same patient’s blood sample treated with magnetite nanoparticles (MCS-B).
A small volume of blood was diluted in an 8% sucrose solution buffered with McIlvaine’s citrate buffer to prevent the solution from conducting electric current. The pH of the solution was adjusted to 7.4, matching physiological blood pH to avoid hemolysis.
For each sample, seven measurements of erythrocyte velocity were taken in opposite directions relative to the electric current in order to eliminate the effect of surface tilt. The mean value was then calculated.
Calculations were performed according to the following formulas:
where:
ω - electrophoretic mobility (cm/ V·s);
S - distance (in cm) travelled by the particle during time t;
t - time (in seconds);
E - potential gradient, i.e., voltage drop per unit length of the conductor;
U - voltage (in V);
r - distance between the ends of the agar siphons (in cm).
The study was conducted in vitro in three stages:
Stage I - electrophoretic mobility of erythrocytes from healthy donors;
Stage II - baseline electrophoretic mobility of erythrocytes from patients with toxemia syndrome;
Stage III - electrophoretic mobility of erythrocytes from patients after treatment with magnetite nanoparticles (MCS-B).
The optimal effective dose of MCS-B was determined based on erythrocyte electrophoretic mobility under different volume ratios of blood to MCS-B (3:1, 2:1, 1:1).
For an in-depth characterization of erythrocyte surface charge, a modern method for determining ζ-potential was additionally employed using Laser Doppler Electrophoresis (LDE) based on phase-shift light scattering (Malvern Zetasizer Nano ZS). The use of this method allowed for the direct quantitative assessment of erythrocyte membrane ζ-potential, validation of EPM data, and elimination of the influence of medium viscosity and ionic strength. Thus, the combined analysis (EPM + ζ-potential) enables a more accurate interpretation of the electrophoretic properties of erythrocytes.
Method for determining the minimum magnetic field strength required for effective extraction of MCS-B from blood.
MCS-B was introduced in vitro into the blood of practically healthy individuals. Using an external constant magnetic field at different field strengths -100 kA/m to 150 kA/m and 200 kA/m to 250 kA/m (measured with a Tesla ammeter F 4354/1; GOST 5.1977-73) - MCS-B was extracted from the blood plasma mixture within 2-3 minutes.
The effectiveness of MCS-B removal from plasma was assessed by determining the concentration of iron (Fe) in plasma in vitro [23] at three time points: before MCS-B administration, after MCS-B administration, and after its extraction using permanent magnets with field strengths of 100 kA/m to 150 kA/m and 200 kA/m to 250 kA/m.
Statistical analysisStatistical analysis was performed according to the structure of the dataset, including paired evaluation of erythrocyte electrophoretic mobility (EPM) and ζ-potential.
Assessment of data normality:
- Each variable was tested using the Shapiro-Wilk test.
Comparison between groups:
- For normally distributed data, the student’s t-test was used.
- For non-normally distributed data, the Mann-Whitney U test was applied.
Comparison among multiple groups:
- One-way Analysis of Variance (ANOVA) with Tukey’s post-hoc test was performed.
Effect size:
- Differences were quantified using Cohen’s d.
Correlation analysis:
- The relationship between EPM and ζ-potential was assessed using Pearson’s correlation coefficient (r). For each paired dataset (EPM vs. ζ-potential), both the correlation coefficient (r) and the statistical significance (p-value) were reported.
Statistical significance criterion:
- Two-sided p<0.05 was considered statistically significant.
Research Results and Discussion
Erythrocyte electrophoretic mobility and its dose dependent response to Magnetite Nanoparticles (MCS-B).
The electrophoretic mobility of erythrocytes serves as an indirect indicator of two fundamental physiological parameters:
- the bioelectrical charge of the erythrocyte membrane, which reflects the functional state and surface potential of red blood cells;
- the rheological properties of blood, particularly the ease with which erythrocytes move through the vascular system under various flow conditions.
Alterations in electrophoretic mobility may therefore signal changes in membrane integrity, surface charge distribution, or systemic hemorheological status - especially under pathological conditions such as toxemia.
In this study, we investigated the dose-dependent effect of magnetite nanoparticles on erythrocyte electrophoretic mobility in patients with toxemia. The data, presented in Table 8, illustrate the dynamic response of this parameter following exposure to varying blood-to-MCS ratios.
Table 8: Electrophoretic mobility of blood erythrocytes before and after treatment with magnetite nanoparticles (М ± m).
| Indicator | Practically Healthy Individuals (n=10) | Patients with Toxemia Syndrome (n=20) | |||
|---|---|---|---|---|---|
| Primary Data | Variants of Blood-to-MCS Ratio | ||||
| 03:01 | 02:01 | 01:01 | |||
| Electrophoretic mobility of erythrocytes, 10−4cm2/V·s | 3.5×10⁻⁴ ± 0.2 | 1.26×10⁻⁴ ± 0.2 | 2.70×10⁻⁴ ± 0.2 | 3.76×10⁻⁴ ± 0.2 | 3.8×10⁻⁴ ± 0.2 |
| P<0.01 | P<0.05 | P>0.05 | P>0.05 | ||
| P1<0.01 | P1<0.001 | P1<0.001 | |||
| P2<0.05 | P2<0.05 | ||||
| P3>0.05 | |||||
The data presented in Table 8 indicate that, in donors (practically healthy individuals), the erythrocyte Electrophoretic Mobility (EPM) was 3.5 × 10⁻⁴ ± 0.2 cm2/V·sec, whereas in patients with toxemia syndrome (main group), the baseline value was 1.26 × 10⁻⁴ ± 0.2 cm2/V·sec.
As a result of blood treatment with magnetite nanoparticles (MCS-B) at a ratio of 3 parts blood to 1-part MCS-B, EPM significantly increased compared to baseline (p<0.01), yet remained significantly different from the normal reference values (p<0.05).
All values are presented as mean ± standard deviation. Statistical significance was determined using Student’s t-test; P<0.05 was considered significant.
At the ratios of 2:1 and 1:1, the EPM decreased even more significantly compared to baseline values (p<0.001) and no longer differed from the normal range (p>0.05). It should also be noted that no statistically significant difference was found between the 1:1 and 2:1 ratio (p>0.05).
Thus, the optimally effective dose of magnetite nanoparticles for improving erythrocyte electrophoretic mobility is the 2:1 ratio (two parts blood to one-part MCS-B). The observed changes provide insight into the potential of magnetite nanoparticles to modulate cell surface charge and improve microcirculatory flow.
The electrophoretic mobility indices of erythrocytes (mean ± standard deviation) in healthy individuals and patients with toxemia before and after treatment with magnetite nanoparticles at different ratios of blood and MCS-B are presented in Figure 5.
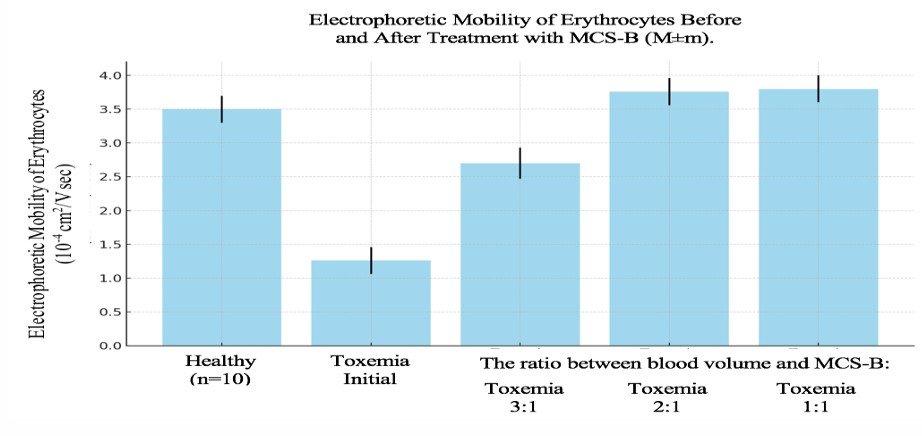
Figure 5: Electrophoretic mobility of erythrocytes at different experimental stages (mean ± SEM).
To visually illustrate the treatment effect, Figure 6 depicts the morphofunctional state of erythrocytes in heparinized blood from a patient with toxemia syndrome, before and after in vitro exposure to MCS-B at a blood-to-sorbent ratio of 2:1.
Figure 6 illustrates pronounced morphological changes in erythrocytes from heparinized blood of a patient with toxemia syndrome before and after in vitro treatment with the nanodrug MCS-B. Following exposure, a resolution of erythrocyte sludging, restoration of the normal discocyte shape, and an increase in the electronegativity of the cell surface were observed. These findings indicate a reestablishment of erythrocyte dispersion and normalization of blood rheological properties.
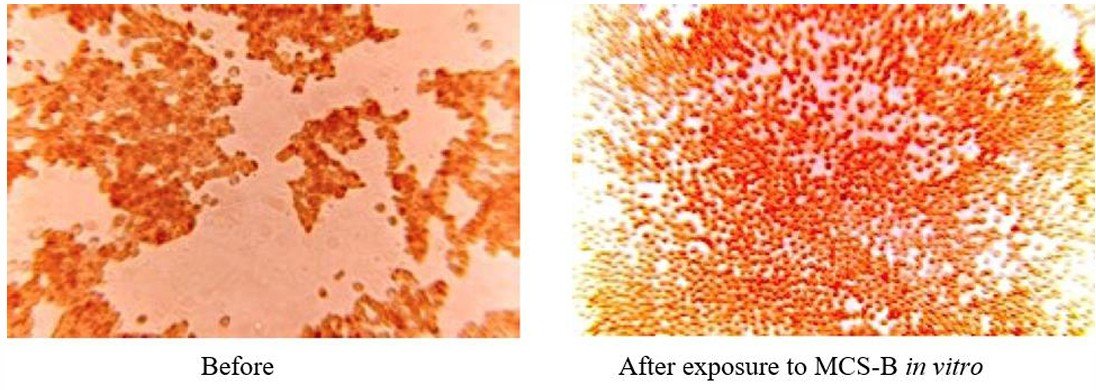
Figure 6: Morphology of erythrocytes in heparinized blood from a patient with toxemia syndrome, before and after in vitro treatment with MCS-B (blood-to-MCS ratio 2:1).
Based on the Electrophoretic Mobility (EPM) data of erythrocytes, a study of membrane ζ-potential was conducted to quantitatively assess the cells’ surface charge. The ζ-potential values enabled the comparison of changes in the electrical properties of the membranes with the functional EPM parameters. Effect size was determined using Cohen’s d, calculated from the difference between baseline and post-MCS-B treatment means with the pooled standard deviation. While d values above 0.8 are considered large, the observed values (d>2.0) reflect an exceptionally strong effect. The magnitude of erythrocyte ζ-potential changes and Cohen’s d effect sizes across study groups following MCS-B treatment is presented in Table 9.
Table 9: Magnitude of erythrocyte ζ-potential changes and Cohen’s d effect sizes across study groups following MCS-B treatment (in vitro, n=30).
| Group | ζ-potential (mB), mean ± SD |
95% CI | Cohen's d (vs baseline) |
|---|---|---|---|
| Healthy donors (n=10) | -18.5 ± 1.8 | [-19.8; -17.2] | - |
| Patients with toxemia (baseline, n=20) |
-11.2 ± 2.0 | [-12.1; -10.3] | - |
| Post-MCS-B (3:1) | -15.4 ± 1.9 | [-16.3; -14.5] | 2.16 |
| Post-MCS-B (2:1) | -18.0 ± 1.7 | [-18.8; -17.2] | 3.44 |
| Post-MCS-B (1:1) | -18.2 ± 1.6 | [-18.9; -17.5] | 3.61 |
The data in Table 9 demonstrate a comparable dose dependent trend. Patients with toxemia exhibited a pronounced decrease in ζ-potential (-11.2 mV ± 2.0 mV), whereas treatment with MCS-B restored it to values not statistically different from controls at ratios of 2:1 and 1:1. The effect size was extremely large (Cohen’s d=2.16-3.61), indicating a marked modulation of erythrocyte membrane surface charge.
For each data pair (EPM ↔ ζ-potential), the Pearson correlation coefficient (r) and the corresponding p-value were calculated, providing an assessment of the strength and statistical significance of the relationship between the parameters. Summary results are presented in Table 10, including means, standard deviations, and correlation coefficients for all studied groups.
The Table 10 data demonstrate a strong linear correlation between erythrocyte Electrophoretic Mobility (EPM) and ζ-potential (r=0.98, p<0.001) with a determination coefficient of R2=0.96. Linear regression analysis yielded the equation ζ=-2.84 × EPM - 8.63, indicating that EPM reliably reflects membrane surface charge. Percentage changes (Δ%) were calculated relative to the baseline intoxication level. Notably, MCS-B treatment resulted in a dose-dependent recovery of both parameters, with EPM values slightly exceeding control values at 2:1 and 1:1 ratios, indicating enhanced membrane electrokinetic activity.
Table 10: EPM, ζ-potential and normalized changes after MCS-B treatment*.
| Group | EPM (×10-4 cm2/V·s) | ζ-potential (mV) | ΔEPM (%) | Δζ (%) |
|---|---|---|---|---|
| Control (donors) | 3.5 | -18.5 | - | - |
| Toxemia (baseline) |
1.26 | -11.2 | -64.00% | -39.50% |
| MCS-B (3:1) | 2.7 | -15.4 | 114.30% | 37.50% |
| MCS-B (2:1) | 3.76 | -18 | 198.40% | 60.70% |
| MCS-B (1:1) | 3.8 | -18.2 | 201.60% | 62.50% |
For clarity, the correlation between erythrocyte electrophoretic mobility and ζ-potential is shown in Figure 7.
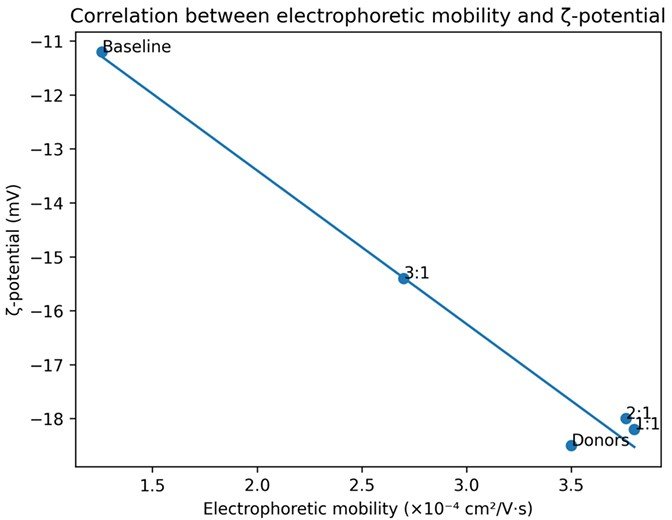
Figure 7: Correlation between electrophoretic mobility and ζ-potential.
Abbreviations: Donors, healthy controls; Baseline, toxemia (initial).
Figure 7 clearly demonstrates an almost perfect inverse correlation between erythrocyte Electrophoretic Mobility (EPM) and ζ-potential (Pearson correlation coefficient r=-0.987, R2=0.975, p<0.001), indicating a very strong relationship between membrane surface charge and the electrokinetic behavior of erythrocytes. Data points represent healthy donors, baseline toxicosis, and post-treatment conditions at different MCS-B ratios (3:1, 2:1, 1:1).
Linear regression analysis showed that the restoration of electrophoretic mobility is directly associated with normalization of the ζ-potential to physiological values.
No statistically significant deviations from linearity were observed, ruling out substantial effects of nonlinear factors such as changes in medium viscosity or ionic strength.
Overall, more than 97% of the variability in ζ-potential is explained by changes in EPM, confirming that the primary mechanism of MCS-B action is the restoration of erythrocyte membrane surface charge rather than modification of plasma rheological properties. In vitro treatment with magnetite nanoparticles (MCS-B) resulted in near-complete recovery of both EPM (94.4%) and ζ-potential (95.1%), indicating restoration of erythrocyte electrostatic stability.
Restoration of the electrokinetic properties of erythrocyte membranes, as evidenced by the near-perfect correlation between ζ-potential and EPM, reduces intercellular aggregation and eliminates the sludging phenomenon. This improves erythrocyte deformability and passage through the microcirculation, thereby directly enhancing capillary perfusion and oxygen delivery to tissues.
Numerous clinical observations of MCS-B use as an extracorporeal hemoadsorbent confirm that its therapeutic effects in endogenous intoxication are primarily mediated through restoration of erythrocyte membrane surface charge. This is particularly evident in the treatment of sepsis, multiple organ dysfunction syndrome, and severe inflammatory conditions.
Thus, MCS-B can be considered a pathophysiologically justified and effective agent for pathogenetic therapy of severe toxemias, which are accompanied by pronounced hemorheological disturbances and impaired oxygen delivery to tissues.
Physiological model of the protective mechanisms of MCS-B of MCS-B on erythrocyte membranes in toxemia is based on previously reliably obtained data:
I. Membrane restoration and detoxification.
Magnetite nanoparticles (MCS-B) effectively adsorb circulating toxins, lipid peroxidation products, and reactive oxygen species [30]. This contributes to the stabilization of the erythrocyte membrane lipid bilayer and the restoration of activity of membrane-associated enzymes such as Na+/K+-ATPase [31]. Restoration of the structural and functional integrity of the membrane is essential for the normal function of glycolytic enzymes that support erythrocyte energy metabolism [32].
II. Reactivation of glycolytic enzymes.
- By correcting ionic balance, pH, and redox potential, glycolytic enzymes regain activity.
- Glycolytic flux increases → more ATP and 1,3-BPG are produced.
- 1,3-BPG is then diverted both to ATP production and to the Rapoport shunt → simultaneous increase in ATP and 2,3-DPG.
III. Restoration of Metabolic Balance.
- After membrane and redox normalization, erythrocytes can resume adaptive responses to hypoxia or acidosis, increasing 2,3-DPG.
- At the same time, global glycolytic output ensures that ATP levels are restored to physiological range.
- This paradox - concurrent increase of both ATP and 2,3-DPG - is possible only after reversal of toxic suppression.
The combined protective mechanisms of MCS-B action on erythrocyte membranes under conditions of toxemia are summarized in Table 11.
Table 11: Summarizes the integrated protective mechanisms exerted by MCS-B on erythrocyte membranes in the setting of toxemia.
| Parameter | Before Treatment (Toxemia) | After Magnetite Exposure |
|---|---|---|
| Membrane potential | Disrupted | Restored |
| Glycolytic activity | Suppressed | Re-activated |
| ATP | Decreased | Increased |
| 2,3-DPG | Decreased or unstable | Increased |
| Electrophoretic mobility | Impaired | Restored |
The aforementioned mechanisms are supported by previous studies in patients with toxemia, which reliably demonstrated a significant decrease in ATP and 2,3-DPG levels due to a generalized suppression of anaerobic glycolysis in erythrocytes [33,34]. Treatment of blood with magnetite nanoparticles (MCS-B) promotes the effective removal of circulating toxic substances, protects and restores the structural integrity of erythrocyte membranes, and stimulates the activation of key enzymes in the glycolytic pathway [32,35]. This leads to simultaneous restoration of ATP and 2,3-DPG concentrations, which, despite their inverse correlation under physiological conditions, reflects the recovery of metabolic potential and energy homeostasis in the pathological state of toxemia [36,37]. Improvement in cellular energetic status induces modulation of the bioelectrical charge on the erythrocyte outer membrane, contributing to normalization of their electrophoretic mobility, reduction of aggregation, and enhancement of microcirculation.
In the present in vitro study, MCS-B was shown to restore erythrocyte electrophoretic mobility and ζ-potential, as well as normalize discoid morphology. Based on these results and literature data [38-42], it can be concluded that the primary interaction of MCS-B with erythrocytes occurs via surface adsorption onto the membrane, which stabilizes the lipid bilayer and the bioelectric charge of the membrane.
No direct evidence of nanoparticle endocytosis by erythrocytes was observed. The physicochemical properties of MCS-B (negative ζ-potential of -19 mV, size 6 nm to 12 nm, high magnetic responsiveness) and the in vitro experimental results support that the nanoparticles predominantly remain on the membrane surface and can be effectively removed by an external magnetic field.
Thus, membrane adsorption represents the primary and clinically relevant mode of MCS-B interaction with erythrocytes, whereas endocytosis was not detected and, according to the literature, is unlikely for mature erythrocytes.
Determination of magnetic field intensity capable of removing Magnetite Nanoparticles (MCS-B) from blood.
The plasma iron concentrations in practically healthy individuals in vitro at different stages of the study are presented in Table 12.
Table 12: Plasma Fe levels in practically healthy individuals in vitro at different stages of the study (n=10; M ± m).
| Study Stage | Plasma Fe Level (nmol/L, mean ± SD) | p-value |
|---|---|---|
| Before MCS-B administration | 124.3 ± 25.6 | - |
| After MCS-B administration | 656.3 ± 31.3 | <0.001 |
| After exposure to constant magnetic field (2-3 min): | ||
| • 100 kA/m -150 kA/m | 214.3 ± 25.6 | <0.05 |
| • 200 kA/m -250 kA/m | 127.4 ± 24.1 | >0.05 |
As shown in Table 6, exposure of blood plasma from practically healthy individuals to a constant magnetic field with an intensity of 100 kA/m 150 kA/m for 2-3 minutes resulted in a statistically significant reduction in plasma iron concentration (p<0.05) compared to post-MCS-B administration values. Nevertheless, the iron level remained significantly elevated relative to baseline, suggesting only partial removal of MCS-B from the plasma under these conditions.
Conversely, application of a stronger magnetic field (200 kA/m to 250 kA/m) for the same duration led to a near complete normalization of plasma iron levels. No statistically significant differences were observed between these post-exposure values and the baseline data (p>0.05), indicating effective elimination of MCS-B from the plasma.
These findings support the hypothesis that magnetically controlled removal of MCS-B is both intensity-dependent and reversible. Specifically, magnetic fields of 200-250 kA/m are capable of achieving highly significant clearance of MCS-B nanoparticles from plasma within 2-3 minutes (p<0.001), confirming the feasibility of external magnetic modulation in regulating the biodistribution of magnetite based nanomaterials.
Safety and regulatory considerations of MCS-B.
This study did not address the toxicity of MCS-B, as it utilized a clinically approved and safe dosage form and a well-established method of administration, both officially approved by the Ministry of Health of Ukraine in 2004. MCS-B, the world’s first magnetite nanoparticle-based sorbent, has over 30 years of extensive experimental and clinical studies confirming its safety and efficacy.
However, it should be emphasized that the overall toxicity of nanoparticles depends on numerous physicochemical characteristics (composition, size, coating, dose, route of administration, sorption capacity, polarizing properties, etc.). Accordingly, the regulatory assessment of nanomedicines is based on function, application, and mechanism of action and includes a comprehensive assessment of safety, quality, and efficacy. In each case, MCS-B complies with national and international regulatory standards, ensuring strict control and confirmed biocompatibility.
Conclusions
- Biocompatible magnetite nanoparticles (MCS-B) effectively restore erythrocyte Electrophoretic Mobility (EPM) in toxemia, representing a novel targeted approach.
- In vitro treatment with MCS-B increased erythrocyte Electrophoretic Mobility (EPM) from 1.26 × 10⁻⁴cm2/V·s to 3.76 × 10⁻⁴cm2/V·s at a 2:1 blood-to-nanoparticle ratio, corresponding to a 198.4% increase (p<0.001), nearly threefold relative to the toxemia baseline.
- Membrane ζ-potential was restored toward normal (Δζ=+60.7%), with a strong correlation between EPM and ζ-potential (r=0.91-0.95; Cohen’s d>1.2).
- Maximal efficacy was achieved at a 2:1 ratio; intermediate effects were observed at 3:1 and 1:1 ratios.
- Application of a constant magnetic field (200 kA/m to 250 kA/m, 2-3 min) allows efficient removal of MCS-B from blood (p<0.001).
- The innovation lies in controllable nanostructures with defined magnetic and surface properties to modulate bioelectrical membrane properties.
This approach has no direct analogues in current clinical practice and provides a foundation for novel therapeutic strategies in transfusion medicine, intensive care, and regenerative medicine.
References
- Durocher JR, Payne RC, Conrad ME. Role of sialic acid in erythrocyte survival. Blood. 1975;45(1):11-20. PubMed ↗
- Terayama K. Effects of lead on electrophoretic mobility, membrane sialic acid, deformability and survival of rat erythrocytes. Ind Health. 1993;31(3):113-26. PubMed ↗
- Gambaro G, Baggio B, Cicerello E, Mastrosimone S, Marzaro G, Borsatti A, et al. Abnormal erythrocyte charge in diabetes mellitus. Link with microalbuminuria. Diabetes. 1988;37(6):745-8. PubMed ↗
- Chabanel A, Flamm M, Sung KL, Lee MM, Schachter D, Chien S. Influence of cholesterol content on red cell membrane viscoelasticity and fluidity. Biophys J. 1983;44(2):171-76. PubMed ↗
- Mohanty JG, Nagababu E, Rifkind JM. Red blood cell oxidative stress impairs oxygen delivery and induces red blood cell aging. Front Physiol. 2014;5:84. PubMed ↗
- Adak S, Chowdhury S, Bhattacharyya M. Dynamic and electrokinetic behavior of erythrocyte membrane in diabetes mellitus and diabetic cardiovascular disease. Biochim Biophys Acta. 2008;1780(2):108-15. PubMed ↗
- Edwards CJ, Fuller J. Oxidative stress in erythrocytes. Comp Haematol Int. 1996;6(1):24-31. PubMed ↗
- Heard DH, Seaman GVF. The influence of pH and ionic strength on the electrokinetic stability of the human erythrocyte membrane. J Gen Physiol. 1960;43(3):635-54. PubMed ↗
- Yamaguchi T, Koga M, Fujita Y, Kimoto E. Effects of pH on membrane fluidity of human erythrocytes. J Biochem. 1982;91(4):1299-304. PubMed ↗
- Mehdi MM, Singh P, Rizvi SI. Erythrocyte sialic acid content during aging in humans: correlation with markers of oxidative stress. Dis Markers. 2012;32(3):179-86. PubMed ↗
- Semenov AN, Lugovtsov AE, Shirshin EA, Yakimov BP, Ermolinskiy PB, Bikmulina PY, et al. Assessment of fibrinogen macromolecules interaction with red blood cell membrane by means of laser aggregometry, flow cytometry and optical tweezers combined with microfluidics. Biomolecules. 2020;10(10):1448. PubMed ↗
- Kopczyński Z, Kuźniak J, Thielemann A, Kaczmarek J, Rybczyńska M. The biochemical modification of the erythrocyte membranes from women with ovarian cancer. Br J Cancer. 1998;78(4):466-71. PubMed ↗
- Bosmann HB, Gersten DM, Griggs RC. Erythrocyte sialic acid and glycoprotein changes in muscular dystrophy. Arch Neurol. 1976;33(2):135-8.
- Rustin MH, Kovacs IB, Sowemimo-Coker SO, Maddison PJ, Kirby JD. Differences in red cell behaviour between patients with Raynaud’s phenomenon and systemic sclerosis and patients with Raynaud’s disease. Br J Dermatol. 1985;113(3):265-72. PubMed ↗
- Adak S, Chowdhury S, Bhattacharyya M. Dynamic and electrokinetic behavior of erythrocyte membrane in diabetes mellitus and diabetic cardiovascular disease. Biochim Biophys Acta. 2008;1780(2):108-15. PubMed ↗
- Daga Ruiz D, Fonseca San Miguel F, González de Molina FJ, Úbeda Iglesias A, Navas Pérez A, Jannone Forés R. Plasmapheresis and other extracorporeal filtration techniques in critical patients. Med Intensiva. 2017;41(3):174-87. PubMed ↗
- Mazzanti L, Rabini RA, Salvolini E, Tesei M, Martarelli D, Venerando B, et al. Sialic acid, diabetes, and aging: a study on the erythrocyte membrane. Metabolism. 1997;46(1):59-61. PubMed ↗
- Lytvyn SY, Vazhnichaya EM, Manno DE, Kurapov AY, Calcagnile L, Rinaldi R, et al. Effect of pure (ligand-free) nanoparticles of magnetite in sodium chloride matrix on hematological indicators, blood gases, electrolytes and serum iron. Micro Nano Syst Lett. 2024;12:20. Springer ↗
- Soler MA, Báo SN, Alcântara GB, Tibúrcio VH, Paludo GR, Santana JF, et al. Interaction of erythrocytes with magnetic nanoparticles. J Nanosci Nanotechnol. 2007;7(3):1069-71. PubMed ↗
- Ruiz A, Ali AML, Cáceres-Vélez PR, Cornudella R, Gutiérrez M, Moreno JA, et al. Hematotoxicity of magnetite nanoparticles coated with polyethylene glycol: in vitro and in vivo studies. Toxicol Res. 2015;4(6):1555-64. Pubs.rsc ↗
- Belousov AN. Extracorporeal hemocorrection using a magnetically controlled sorbent in intensive care of intoxication syndrome in patients with hepatopancreatoduodenal pathology. Dnipro: Dnipropetrovsk State Medical Academy; 2004.
- Belousov AN. Effect of magnetite nanoparticles on cellular metabolism. Visnyk Probl Biol Med. 2004;(2):34-7. ResearchGate ↗
- Belousov AN, Obolentsev NI. Experimental study of the sorption activity of a magnetically controlled hemoperfusion sorbent with respect to blood protein complexes. In: Anesthesiology and Intensive Care at the Turn of the 21st Century. Dnipropetrovsk; 1998:14-15.
- Belousov AN. The use of magnetite nanoparticles in applied medicine. Int J Nano Dimens. 2011;2(1):25-28.
- Belousov AN. Ultrastructure of hepatic cells in rabbits after injection of nanoparticles MCS-B. In: NSTI Nanotech 2012 Proceedings. CRC Press; 2012:258-260.
- Belousov AN, Belousova EY. Mechanisms of cell regulation by nanotechnology preparations (MCS-B). Presented at: BioNanotech Conference & Expo. 2012:18-21.
- Belousov AN, Belousova EYu, Mysyk AV. A clinical case of the successful application of magnetite nanoparticles in the complex treatment of multiple sclerosis. J Nanotech Nanobiotech. 2025;1(1). ScitechJournals ↗
- Belousov A, Malygon E, Yavorskiy V, Belousova E. Modernization of the preservative solution for red blood cells by magnetite nanoparticles (ICNB). In: Alexander D, Pogrebnjak A, Pogorielov M, Viter R, eds. Nanomaterials in Biomedical Application and Biosensors (NAP-2019). Springer Proc Phys. 2020;244:265. Springer ↗
- Burlakova EV, Kols OR, Krigger YA. Practicum on General Biophysics. Moscow: Nauka; 1958:86-98.
- Belousov AN, Malygon EI, Yavorskiy VV, Belousova EY. Innovative method of nanotechnology to increase the storage time of RBCs due to stabilizing the molecular structure of proteins and lipids of erythrocyte membranes. Biomed J Sci Tech Res. 2019;13(4):10079-88. BioMedres ↗
- Belousov AN. The influence of magnetite nanoparticles (MCS-B) on the hemolysis of erythrocytes. In: NSTI-Nanotech 2011 Conference and Expo Technical Proceedings. Danvers (MA): CRC Press; 2011:484-9.
- Belousov AN, Malygon EI, Kalynychenko TO, Belousova EY, Yavorskiy VV, Anoshyna MY. Glycolysis process activation in preserved red blood cells by nanotechnological treatment of resuspending solutions. Regul Mech Biosyst. 2023;14(1):10-15. Medicine.DP ↗
- Torrance J, Jacobs P, Restrepo A, Eschbach J, Lenfant C, Finch CA. Intraerythrocytic adaptation to anemia. N Engl J Med. 1970;283(4):165-169. PubMed ↗
- Mohanty JG, Nagababu E, Rifkind JM. Red blood cell oxidative stress impairs oxygen delivery and induces red blood cell aging. Front Physiol. 2014;5:84. PubMed ↗
- Belousov AN, Malygon EI, Kalynychenko TO, Belousova EY, Yagovdik MV. Nanotechnological innovations: a modern outlook on solving challenges in erythrocyte preservation during storage. Acta Sci Biotechnol. 2024;5(1):26-35. ActaScientific ↗
- Valeri CR, Fortier NL. Red cell 2,3-DPG, ATP, and creatine levels in preserved red cells and in patients with red cell mass deficits or with cardiopulmonary insufficiency. In: Brewer GJ, ed. Red Cell Metabolism and Function. Adv Exp Med Biol. Boston (MA): Springer; 1970:289-303.
- Oski FA, Travis SF, Miller LD, Delivoria-Papadopoulos M, Cannon E. The in vitro restoration of red cell 2,3-diphosphoglycerate levels in banked blood. Blood. 1971;37(1):52-58. PubMed ↗
- Belousov A, Malygon E, Yavorskiy V, Belousova E. Simple and practical method of additive modernization of preservation solutions that does not violate compliance requirements and improves the quality, efficiency, and safety of transfusion of preserved RBCs. Int J Hematol Blood Disord. 2018;3(2):1-9. Symbiosis ↗
- Belousov A, Malygon E, Yavorskiy V, Belousova E. Application of nanotechnology for the preservation of red blood cells. J Adv Nanotechnol. 2018;1(1):18-31. OpenAccessPub ↗
- Belousov A. Investigation of the effect of magnetite nanoparticles (MCS-B) on human platelet aggregation. Iberoam J Med. 2020;2(1):24-29. SciELO ↗
- Piosik E, Zaryczniak A, Mylkie K, Ziegler-Borowska M. Probing interactions of magnetite nanoparticles coated with native and aminated starch with a DPPC model membrane. Int J Mol Sci. 2021;22(11):5939. PubMed ↗
- Yadav S, Maurya PK. Recent advances in the protective role of metallic nanoparticles in red blood cells. 3 Biotech. 2022;12(1):28. PubMed ↗